Bike City
A shinydashboard showing real-time bike usage across San Francisco.
Bike City brings the city to life on your phone. You open Bike City and find the nearest bike to borrow. Then, where do you go? That’s where the “data product” part comes in. On the back end, Bike City scrapes websites for data related to the what, where, when and who in the city. All of this data is presented for you to interact with on your phone. Then, fully informed, you choose your own adventure.
Calendars of events are layered based on their category, such as museum exhibitions, movies, etc. New and trending restaurants and cafes are automatically added and updated. Augmented reality (think Pokemon on the loose) and structured challenges (ex. visit 5 landmarks for scenic pictures).
A social media component allows users to create their own events and challenges and share their results with others. Companies can post their own events. (This where advertising comes in.) Machine learning can recommend events based on past history. A day with Bike City becomes a day to share, and those network effects lead to increases in user adoption.
What’s best about this app is how well it scales. There are hundreds of cities where Bike City can host an application. It would make other cities seem more accessible. (Ever try wandering around a foreign city? Actually, this is fine too, but the app is an option.)
Until then, I’d like to share my data visualization dashboard, which displays the location and concentration of available bike shares in San Francisco, as well as an analysis of the data.
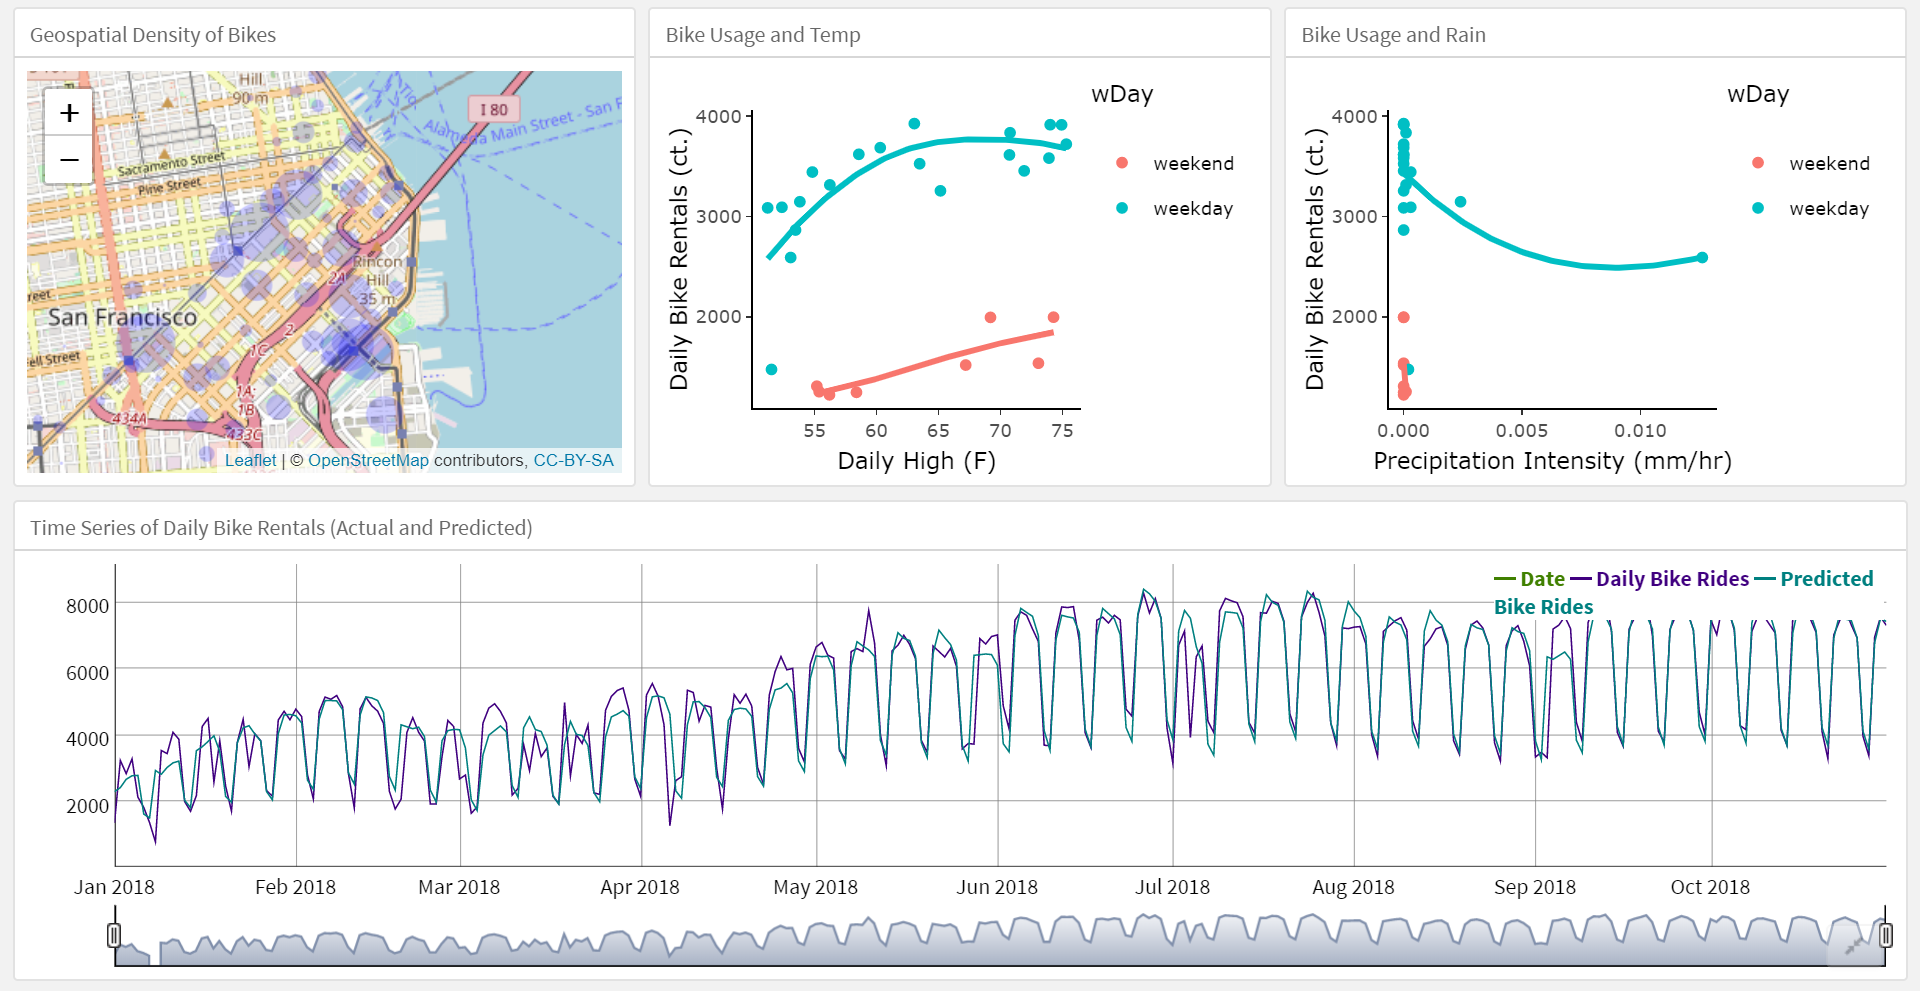
Published as an Rpub here