An Exploratory Investigation of University of California Admissions
Admissions locally and globally, and the effect on competition.
Scandals in college admissions seem to have become perpetual news. Recently, the UC system has been accused of “rigging” admissions in favor of international students. I won’t be taking a side in this debate, rather, I’ll present recent trends in UC admissions and incoming Freshman GPA requirements and invite you to draw your own conclusions.
I’ll begin by looking at students within CA only, then shift to a UC-oriented/worldwide perspective.
CA Admits
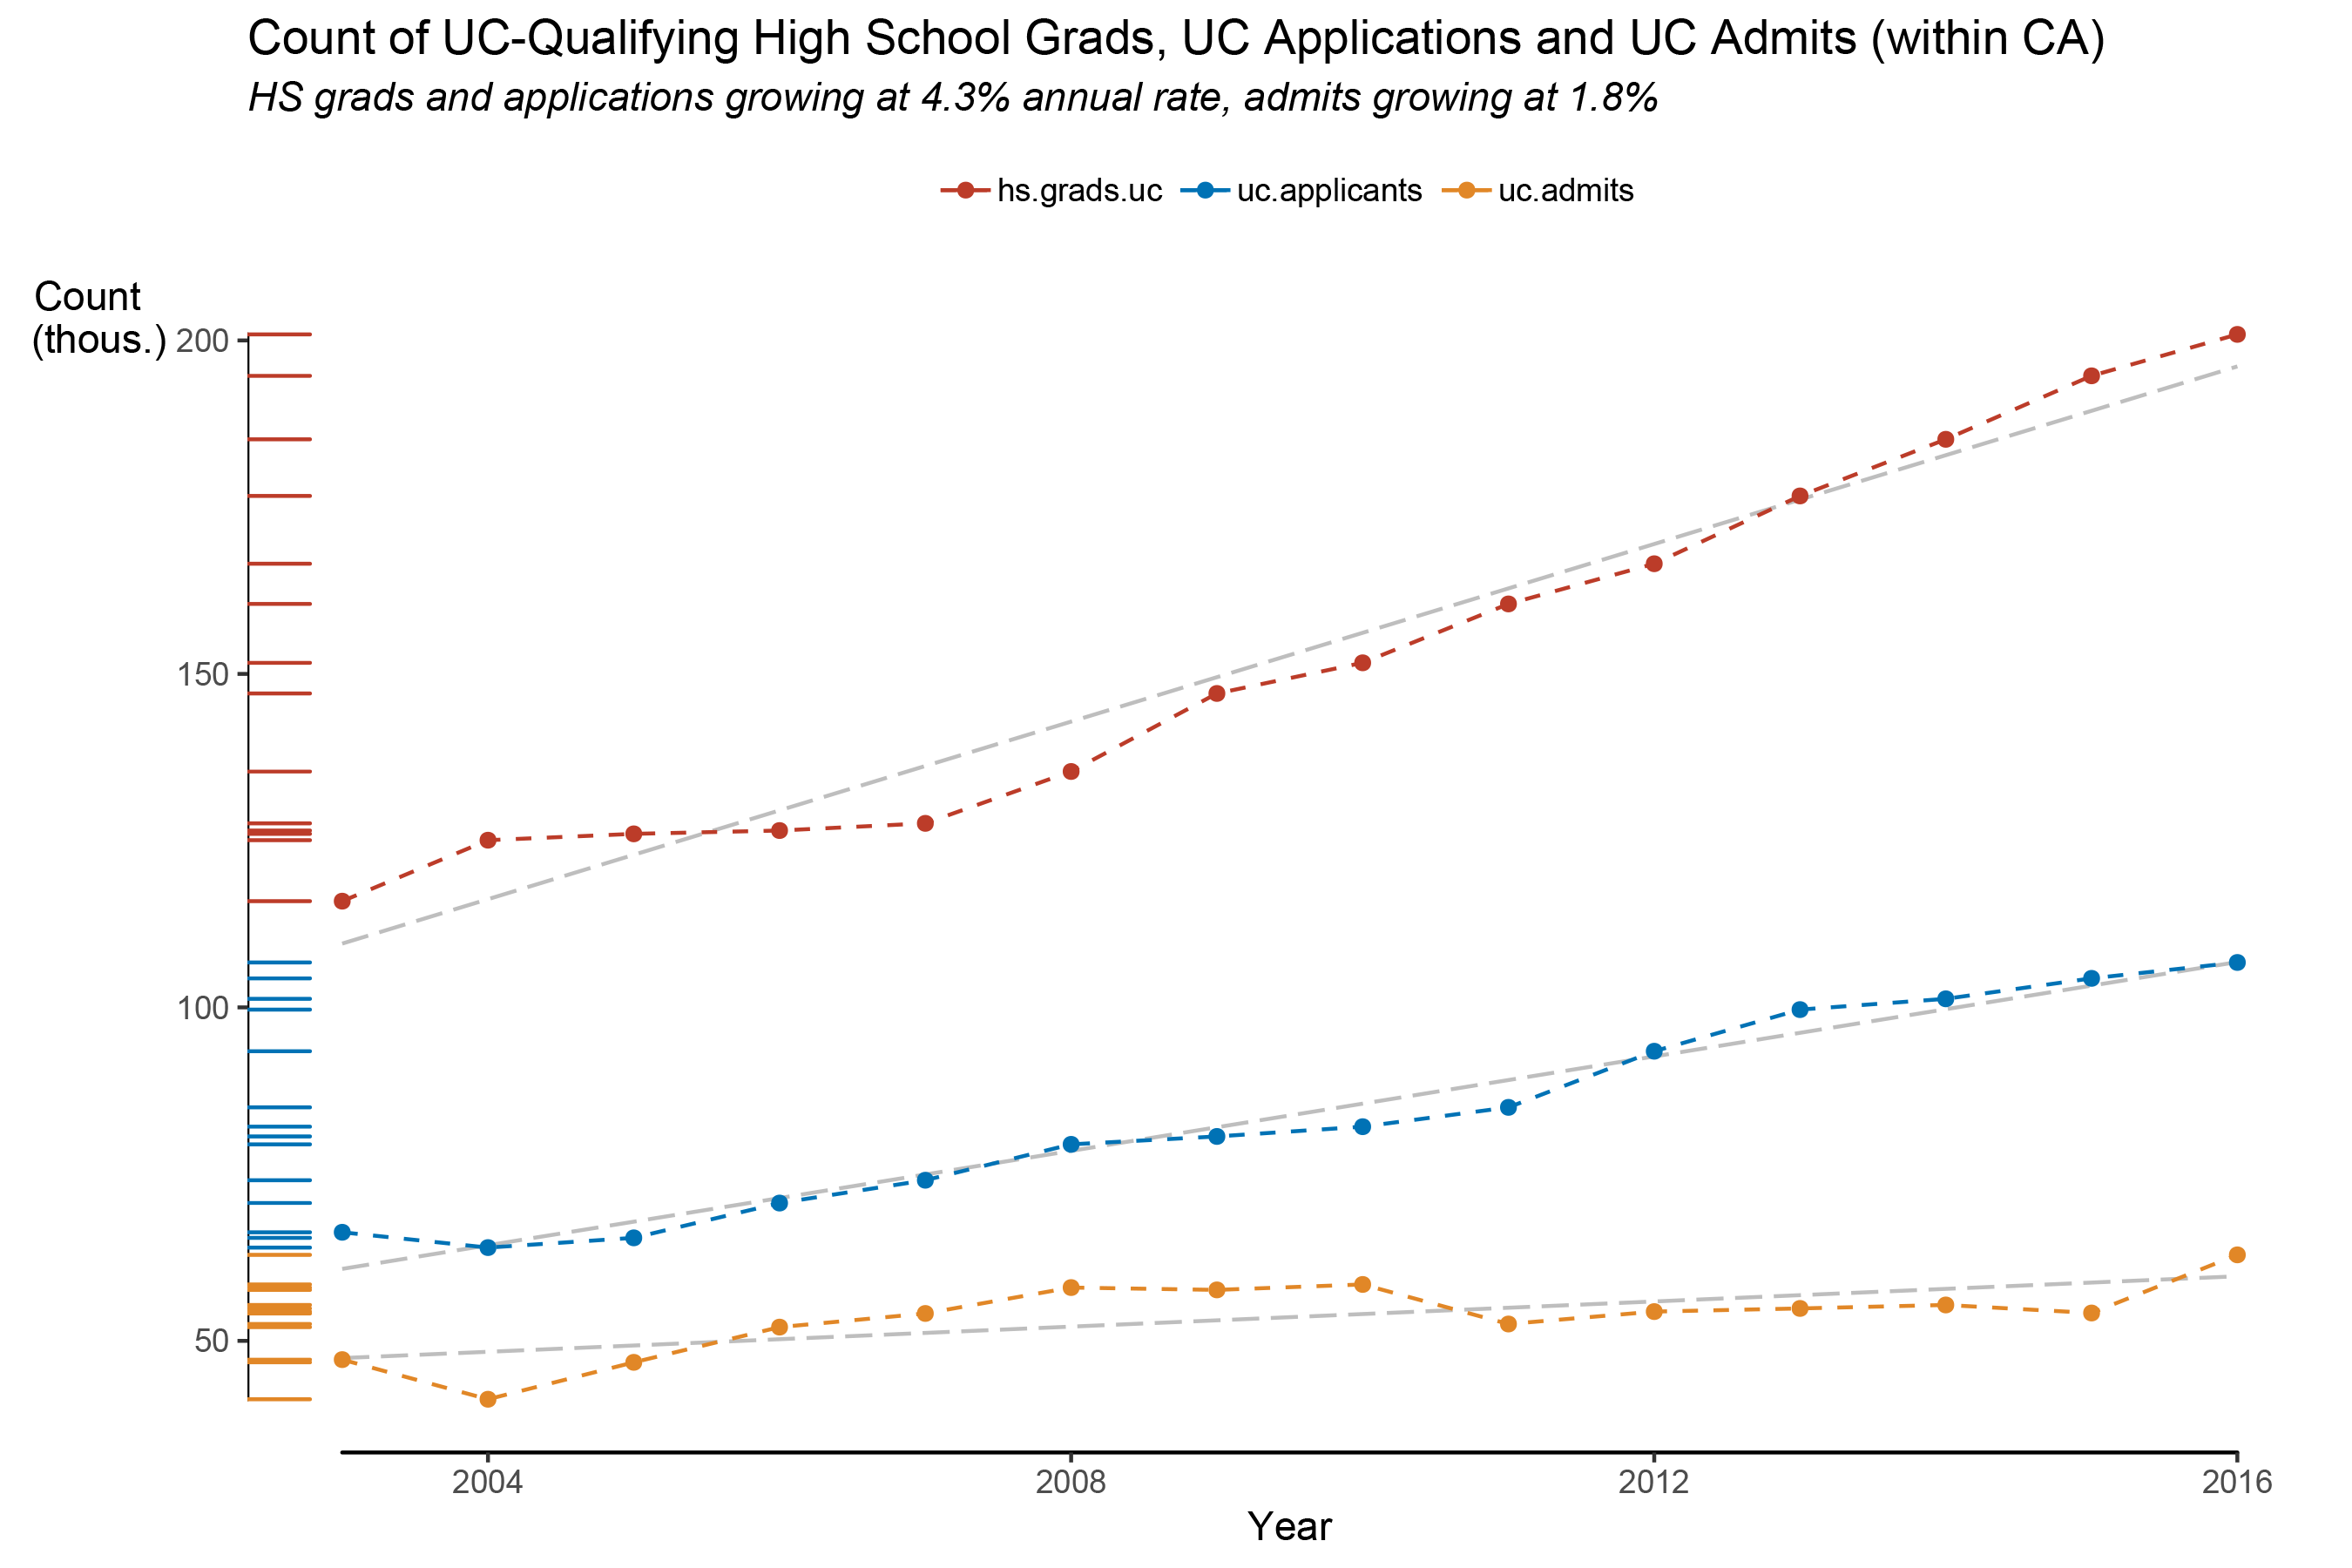
Within CA, the number of UC-qualifying high school grads (that is, graduating high school students who meet the requirement criteria of the UC system) and UC applications are increasing at the same rate of about 4.3% per year. Even so, the gap between the the number of qualifying high school graduates and the count of UC applicants is widening. This is not because the rate of growth is different, rather, the base rates are different.
The number of UC admits (the number of students accepted, but not necessarily the number enrolled) is increasing at a rate of only 1.8% per year. Both the base rate and the rate of growth in admits are less than the number of applications. From 2003 to 2016, the gap between applicants and admits widened from 8,000 to 30,000 applicants.
Next, let’s look at overall UC applications and admits by high school educational institution. The UC system defines four different types of HS educational institution: CA public high schools, CA private high schools, non-CA domestic high schools (ie. other 49 states) and international schools. The chart below shows the total number of applicants and admits to the UC system (data here).
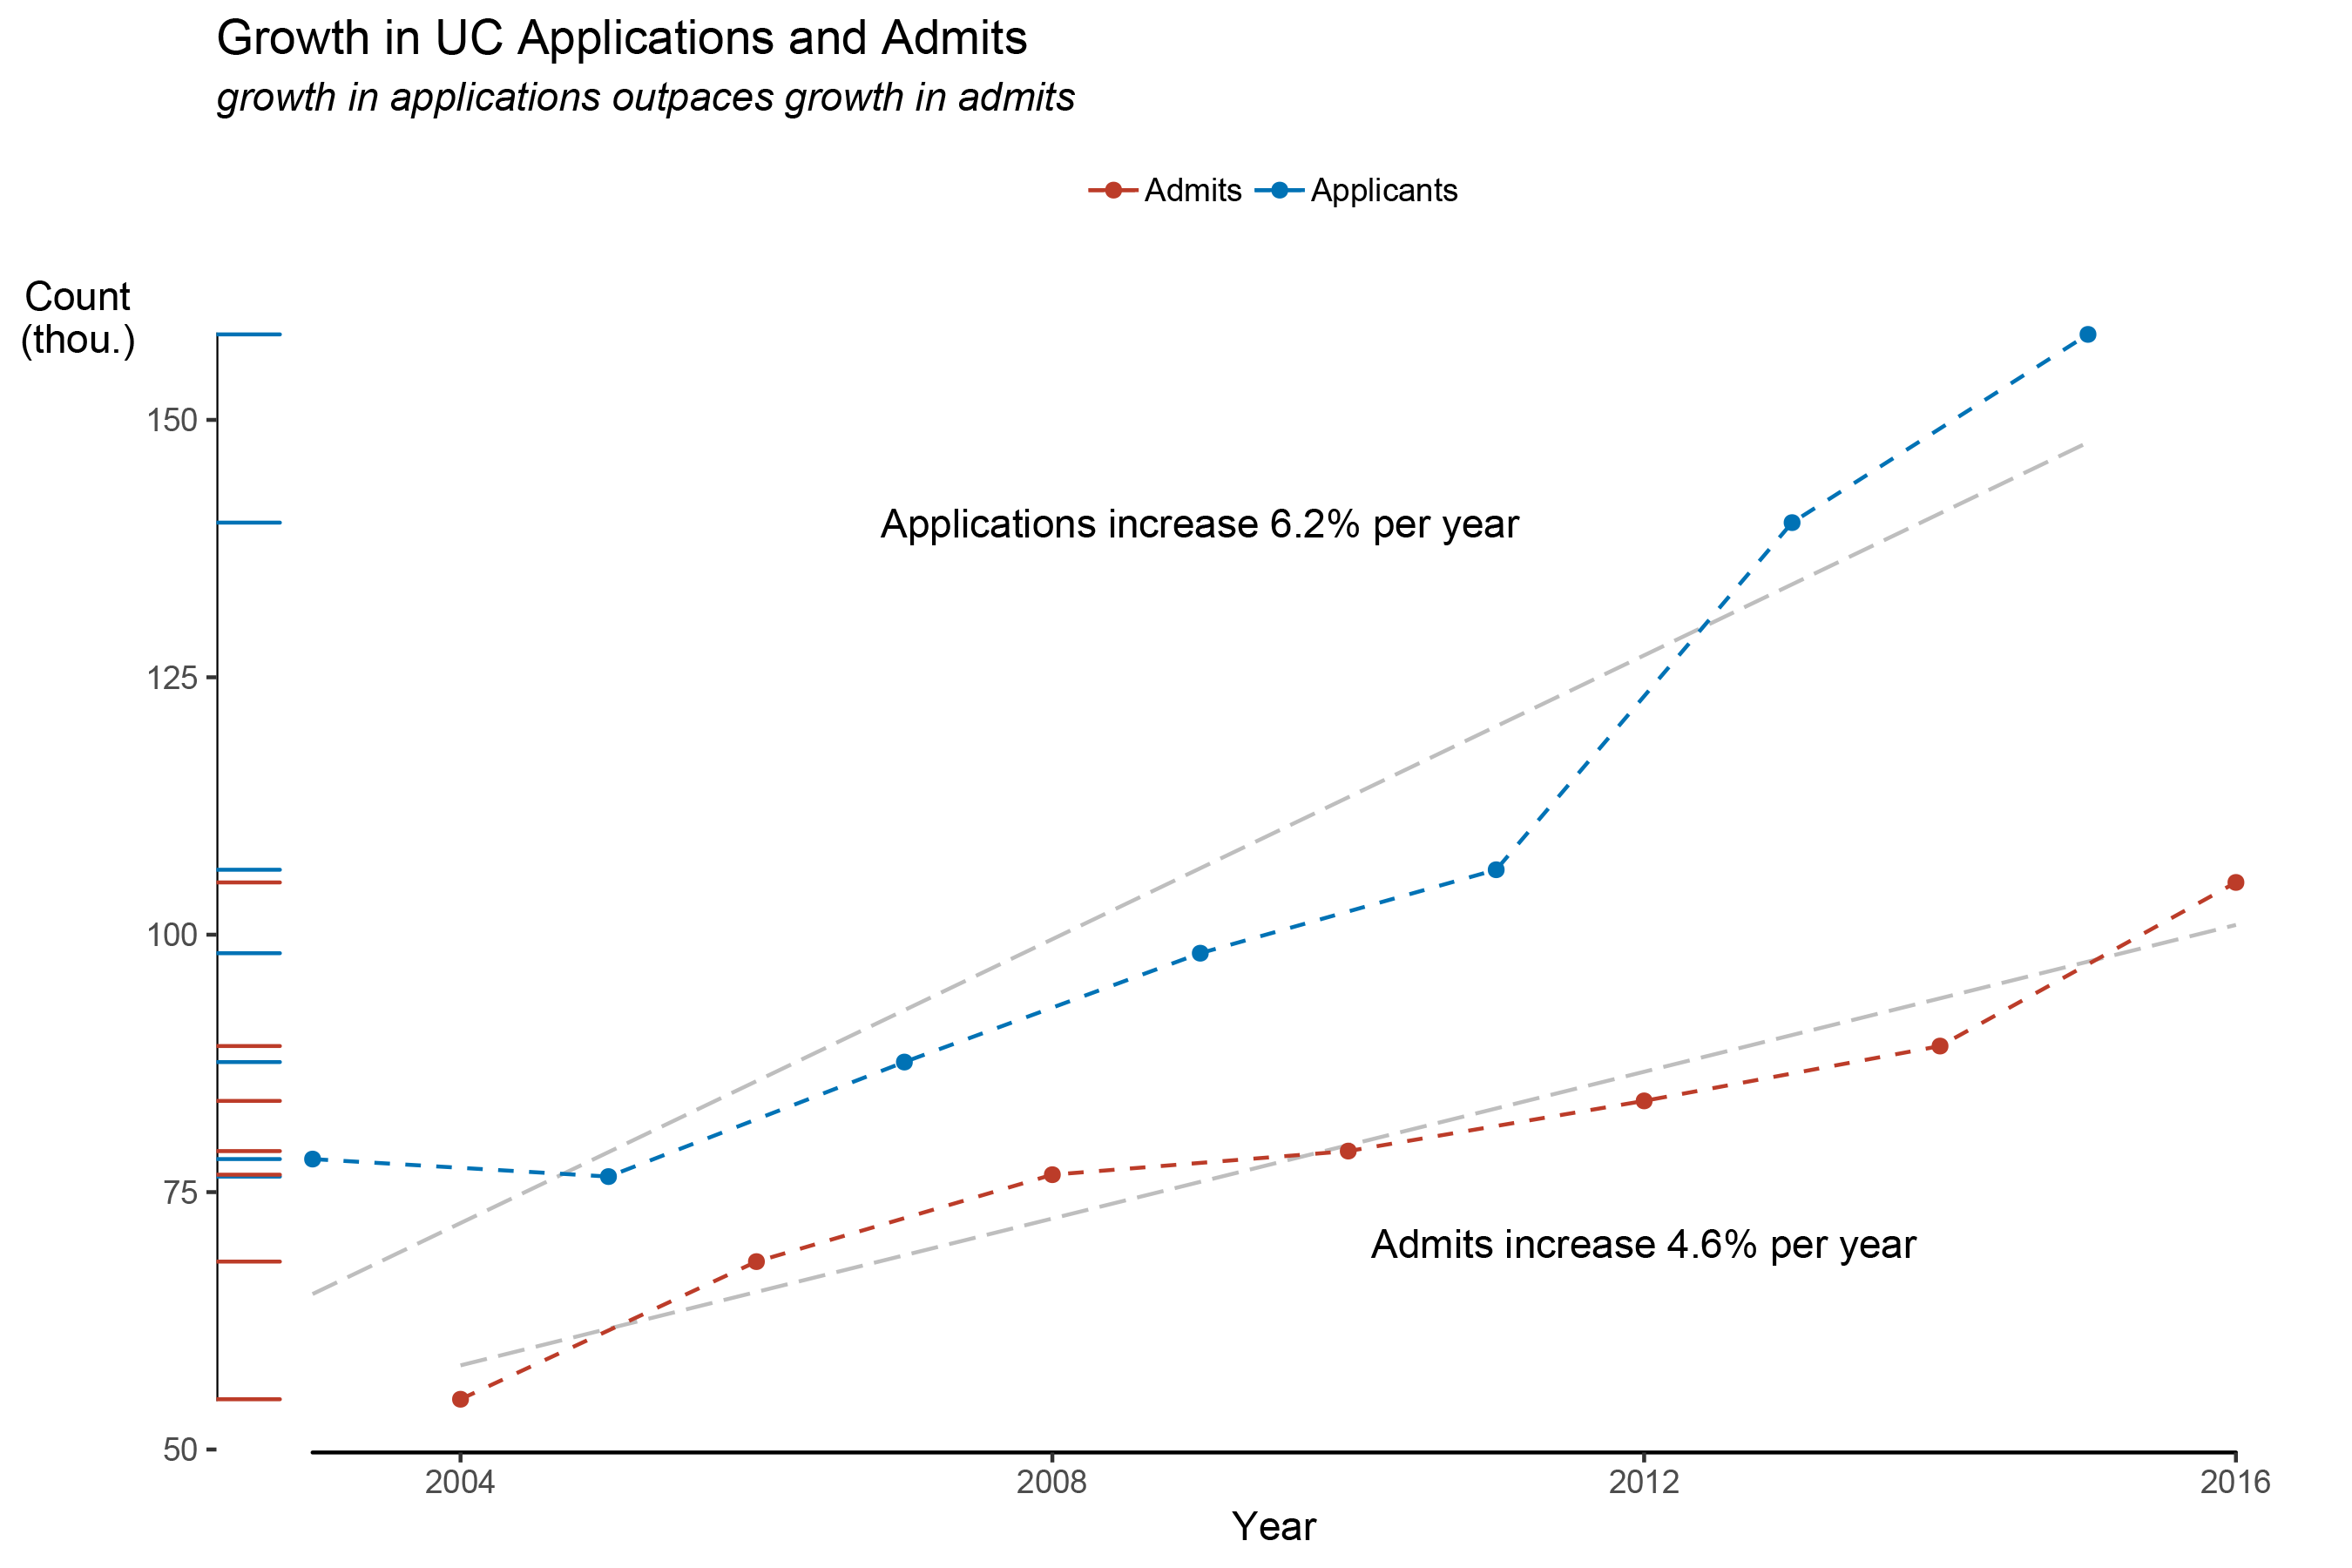
Since 2003, the total number of applications to the UC system has doubled. The number of admits has nearly doubled. That’s astounding growth, given that the newest UC campus, UC Merced, opened all the way back in 2005.
Although the number of admits has increased by 55,000 students since 2003, the number of admits from CA high schools has increased by only 15,000 students. The graph below shows that the increase in admits can be attributed mostly to international and out-of-state students.
Out-of-state and International Students
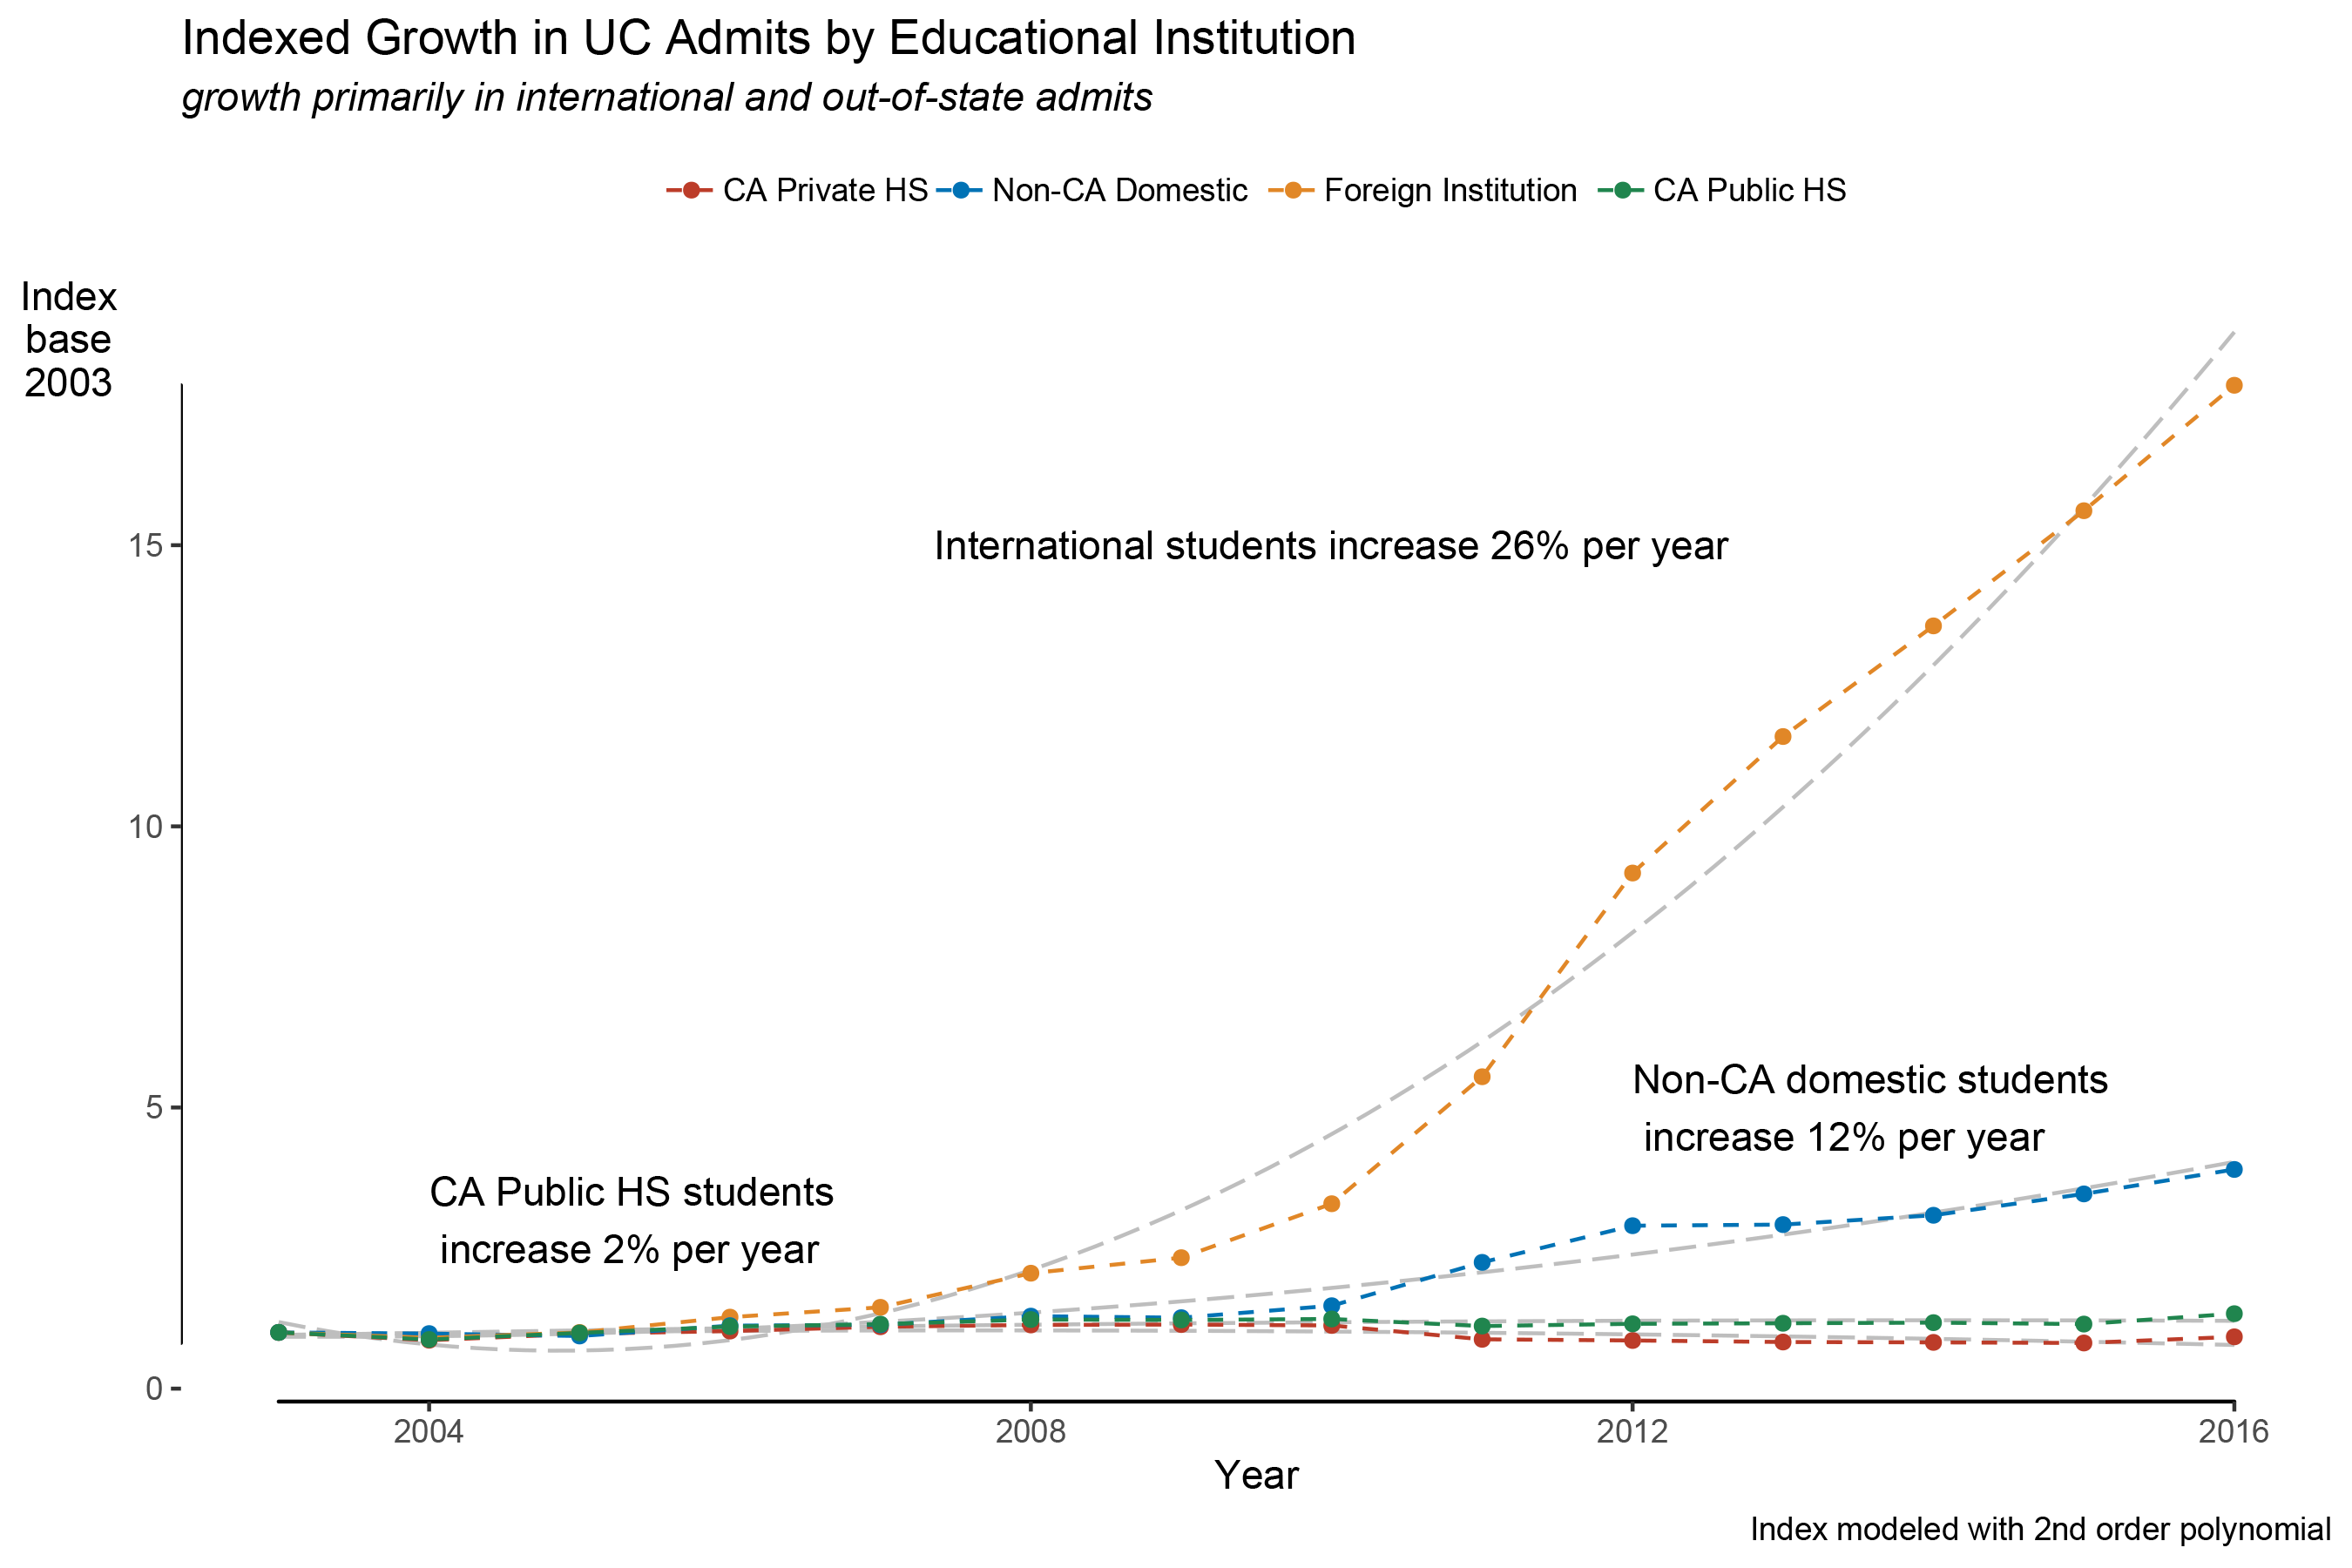
While there has been only 2% growth in the rate of within-CA admits, the majority of students in the UC system are still from CA public schools.
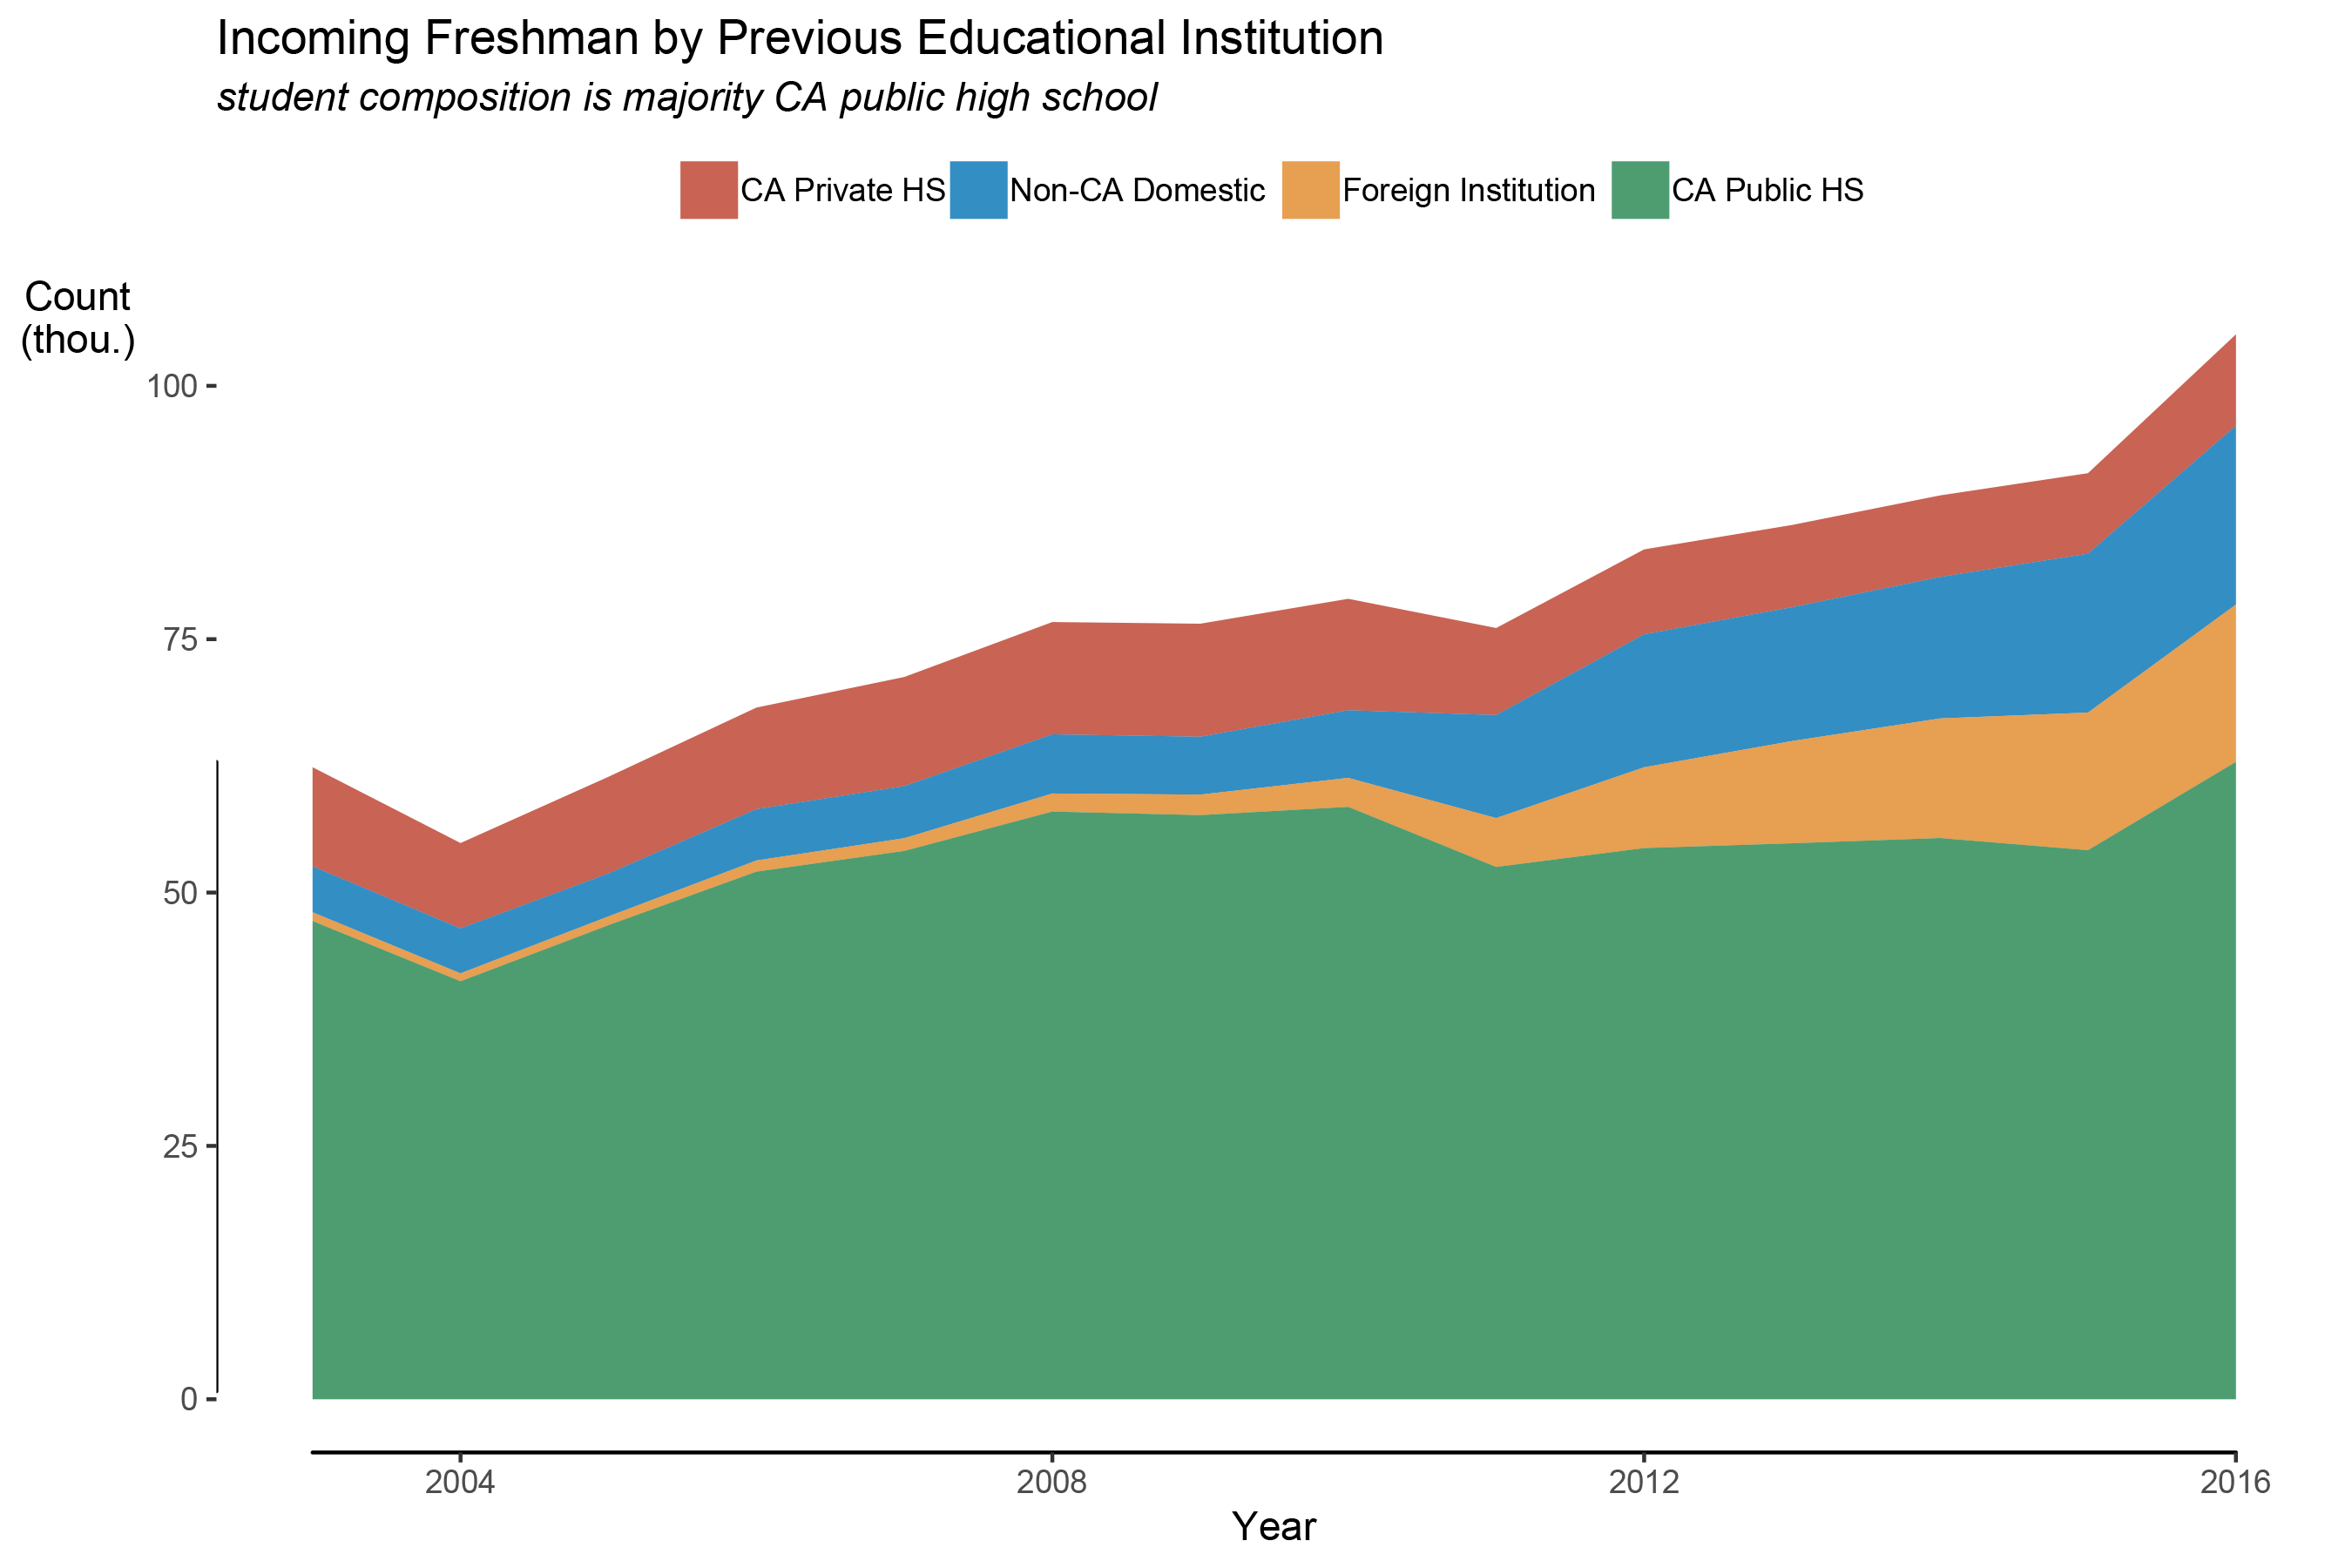
In 2016, 68% of UC students graduated from CA high schools. About 16% of students were from out of state, and 16% from out of country (compared to almost none in 2003).
Competition for Admissions
What effect does the increase in competition have on the standards for admission? That’s a complicated question because there are various criteria for admission: GPA, SAT/ACT, extra curriculars, choice of major, etc. Because this is just a blog post, we’ll focus on high school GPA’s for incoming Freshman only.
The UC system annually publishes common data sets for each college, which include the distribution of unweighted (ie. a 4.0 scale) high school GPAs as well as the mean weighted GPA’s.
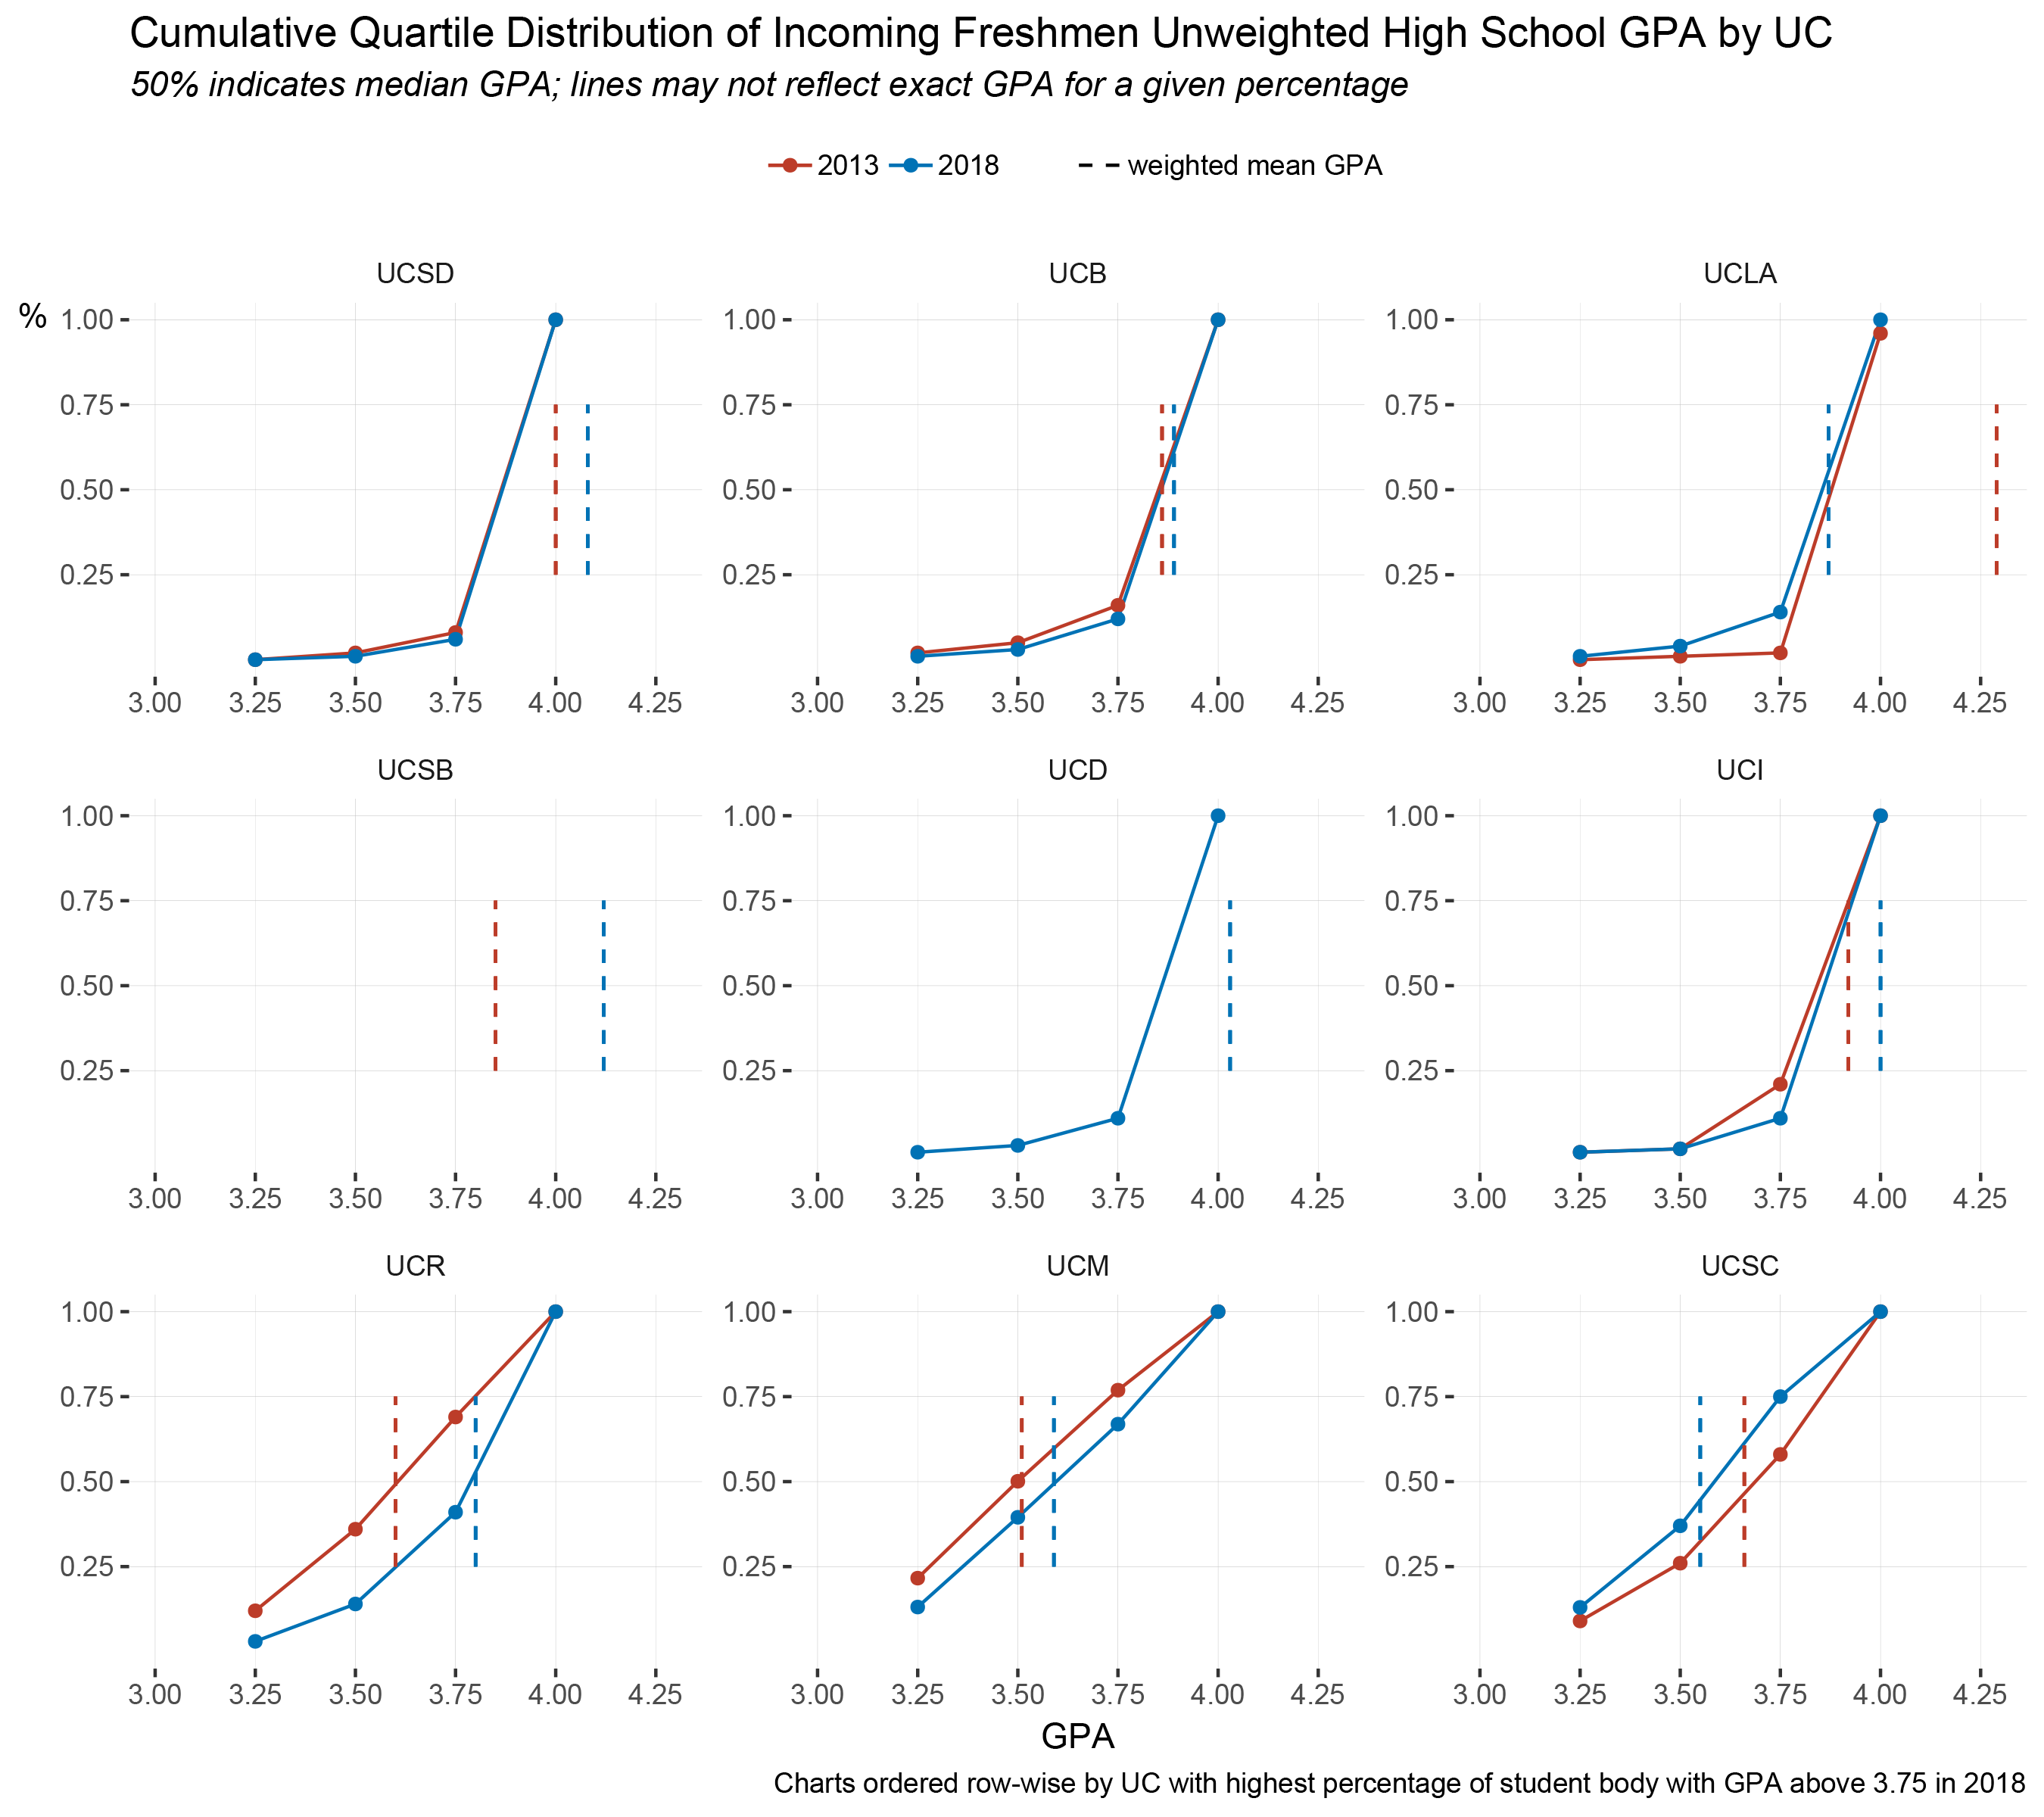
Overall, the median unweighted high school GPA for incoming Freshman is greater than 3.5 for all UC schools and greater than 3.75 for the top 6 of 9 colleges. This has not changed in the last 5 years.
Even with the high admissions standards circa 2013, it seems that getting into the UC system is becoming even more difficult. Between 2013 and 2018, UC Riverside and UC Merced raised their median GPA requirements towards 3.75. UC Santa Cruz is the only university that has lowered their unweighted GPA criteria since 2013.
The mean weighted GPA, which can exceed 4.0, has increased at all colleges except UCSC and, surprisingly, UCLA. The average incoming high school GPA is above 4.0 at UC San Diego, UC Santa Barbara and UC Davis.
Overall, the trends in increasing GPA is consistent with a model of increased competition for admission among students, both domestic and international. Further research on this topic can examine other effects of increased competition, including students’ mental health, changes in other admission criteria, and a student’s decision to attend a different school, such as a CSU or a community college (or no school at all).
Post Script
In writing this post, which took about a week, I learned a few things that I’d like to share.
First and foremost, I learned about the importance of statistical reasoning, defined as learning about the real world using data. The internet is bombarded with articles about the latest deep learning methods, R packages for Bayesian statistics, etc. Thinking cogently with descriptive statistics is a necessary pre-requisite for the fancy stuff.
Stringing together a lattice of statistics can create a model for understanding the world. The struggle is to keep things simple and representative. A lot of decisions have to be made in choosing relevant variables, values, comparisons and visualizations.
For example, in this analysis, I had to choose a time period to study changes in admissions and GPA standards. I chose 2003 for the earliest UC admissions data because that’s the year I graduated high school. I chose 2013 for the earliest GPA data because that’s what was available for most UC’s. I chose to look at admits instead of enrollees because what matters to students is getting accepted, not necessarily enrolling. These decisions should always be acknowledged explicitly in writing.
When writing about statistics, I find that I’m constrained by language. Compared to graphs and equations the written word is the base level of complexity but is the entry point for the reader. Statistical writing should be fluid, flowing between graphs and equations and filling in the gaps. Narrative takes primacy and numerical highlights and representative anecdotes connect the story with the data. Writing feels almost separate from the research process, so much so that I write best after taking a break in order to distance myself from the statistical analysis.
Also in this post, I’ve also taken the opportunity to update my graphic design principles since reading some Edward R. Tufte. These principles include the maximizing the data-ink ratio, labeling/annotating plots and knowing when to break the rules. Since I publish on the internet, I’ve learned more about trade-offs between image compression and file size.
And as always, I’m learning to write and label my code as well possible. I often learn to code better only after reviewing my initial code. There’s a surprising amount of potential for improvement in this.